US Advance GDP estimate expectations and impact on Dollar
 Jul 30th, 2026
 5 mins


The U.S. Bureau of Economic Analysis (BEA) is set to release its Advance Estimate for Q2 2026 Gross Domestic Product (GDP) today, Thursday, July 30, 2026. As the most comprehensive measure of total U.S. economic output, this first official look at second-quarter growth arrives at a pivotal juncture for global financial markets.
Coming less than 24 hours after the Federal Reserve delivered a "hawkish hold" on interest rates backed by a rare three-way dissent pushing for higher borrowing costs today's GDP report will confirm whether the American economy is pulling off a smooth "soft landing" or decelerating under the weight of sustained financial tightening and geopolitical energy friction.
Q1 Momentum and Structural Shifts
To analyze today's second-quarter expectations, we must examine the performance trajectory established over the first half of the year:
● Q1 2026 Baseline: Real GDP grew at an annualized rate of 2.1% in Q1 2026. This marked a solid rebound from the sluggish 0.5% growth recorded in Q4 2025, driven largely by a recovery in government activity following late-2025 shutdown disruptions and robust business investment.
● AI Investment Engine: Business spending on equipment and intellectual property served as a primary growth driver in Q1, surging by over 13% to 15% as corporations poured capital into artificial intelligence (AI) infrastructure and technology integration.
● Consumer Slowdown: In contrast, private consumer spending—the historical backbone of U.S. GDP—slowed noticeably to 0.5% in Q1. High borrowing costs, sticky living expenses, and depleted post-pandemic savings forced households to trim discretionary goods purchases.
What are We Expecting Today and Why?
Wall Street consensus forecasts point toward a moderate, controlled expansion for Q2 2026 annualized GDP, generally targeted between 1.6% and 2.0%:
● Advance Q2 GDP Forecast Consensus: Expected to print around +1.8% to +2.0% annualized.
● GDP Price Index Forecast: Expected near +2.8% to +3.0%, reflecting lingering core inflation pressures.
Key Drivers Behind Today's Q2 Figure:
1. Sustained Corporate Capital Expenditure: Tech-sector investment in AI infrastructure, data centers, and equipment is expected to remain a significant positive contributor to gross private domestic investment.
2. Net Export Rebalancing: Following severe trade drag in early 2026 due to front-loaded import spikes, secondary trade adjustments and stabilizing export volumes are expected to provide a less negative net trade contribution.
3. Muted Household Demand: Personal consumption expenditures (PCE) are projected to show only modest growth as high credit card interest rates and persistent living costs weigh on middle-income household budgets.
Relevance for the US Economy and the Federal
Reserve
Today's GDP print acts as the ultimate reality check for Federal Reserve policy:
● Validating the "Hawkish Hold": Yesterday, the FOMC held interest rates steady at 3.50%–3.75%, but three regional Fed presidents dissented in favor of an immediate 25-basis-point rate hike. A strong GDP print today would validate the hawkish dissenters' view that the economy is running hot enough to absorb further monetary tightening to curb inflation.
● Recession vs. Soft Landing: Conversely, a GDP print holding above 1.5% demonstrates structural resilience, keeping fears of an imminent recession at bay while allowing inflation to cool in an orderly fashion.
Multi-Scenario Analysis for the U.S. Dollar
Because GDP growth influences expectations for future interest rate differentials, today’s release will drive sharp directional volatility across major pairs (EUR/USD, USD/JPY, GBP/USD) and spot gold (XAU/USD).
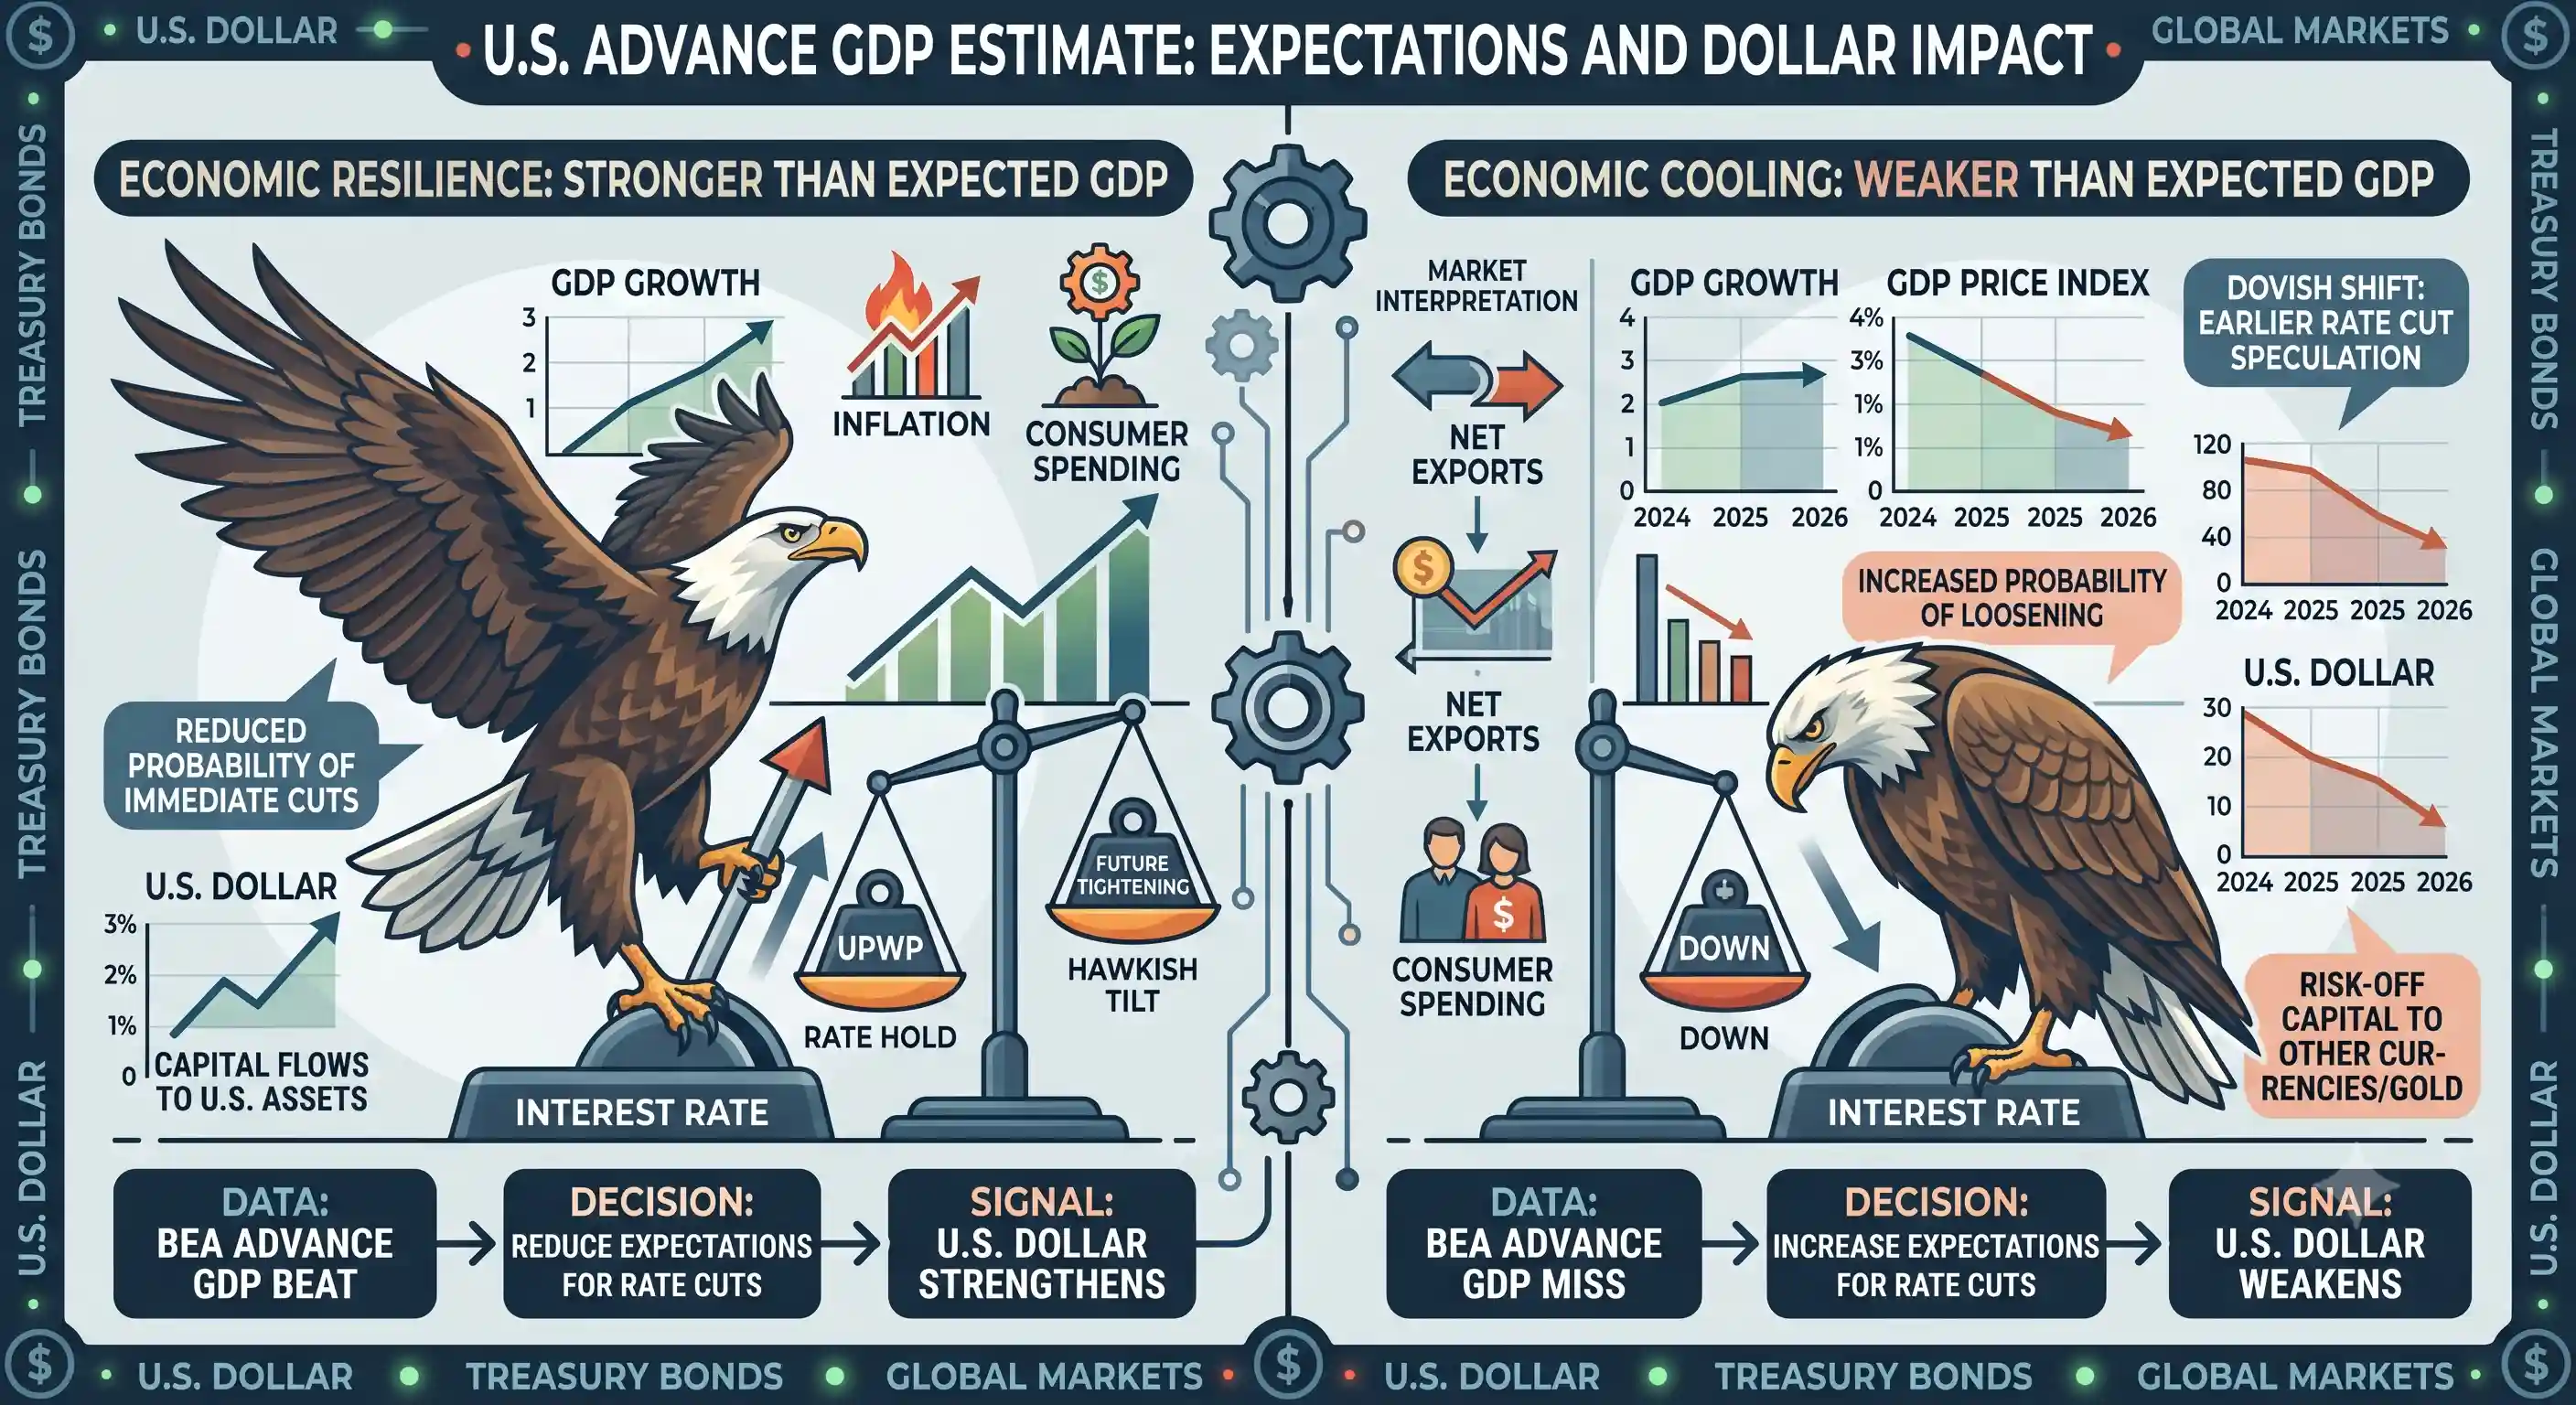
Scenario A: GDP prints at +2.3% or higher
● Macro Context: Growth significantly exceeds expectations, proving that corporate investment and trade efficiency are easily offsetting consumer headwinds. This signals that the economy has plenty of momentum, virtually locking in market expectations for a 25-basis-point Federal Reserve rate hike at the September meeting.
● Dollar Impact: U.S. Dollar surges aggressively across all currency pairs.○ USD/JPY: Advances cleanly as rising U.S. Treasury yields widen the interest rate advantage over the Bank of Japan.
○ EUR/USD & GBP/USD: Come under immediate selling pressure as global capital flows into higher-yielding U.S. assets.
○ XAU/USD (Gold): Faces a sharp selloff as rising real bond yields elevate the opportunity cost of holding physical bullion.
Scenario B: GDP prints between +1.7% and +2.0%
● Macro Context: Growth aligns with expectations, confirming a controlled, non-inflationary glide path. The economy is expanding, but not at a pace that forces an immediate, panic-driven central bank reaction.
● Dollar Impact: U.S. Dollar remains range-bound. Foreign exchange desks will digest the headline smoothly, turning their attention to underlying PCE inflation components within the report for secondary intraday setups.
Scenario C: GDP prints below +1.2%
● Macro Context: Growth cools far faster than anticipated, driven by a sharp drop in consumer spending and falling inventory accumulation. This raises immediate warning flags about second-half economic weakness, forcing markets to price out near-term rate hikes and speculate on dovish Fed easing.
● Dollar Impact: U.S. Dollar experiences a broad-based decline.
○ USD/JPY: Drops sharply as Treasury yields slide, forcing an unwinding of long-dollar carry positions.
○ EUR/USD & GBP/USD: Rally past key technical resistance zones.
○ XAU/USD (Gold): Spikes higher, fueled by falling yields and defensive safe-haven demand.
Today's Advance Q2 GDP release serves as the definitive gauge of U.S. economic momentum at mid-year. For currency traders and macro investors, the margin of divergence from the 1.8%–2.0% consensus will establish whether the U.S. Dollar builds on yesterday's hawkish Fed positioning or faces a retracement.